Connect Sales, Marketing, Operations, Customer Success and Collections in one platform. Get complete visibility into business performance, identify bottlenecks and make smarter decisions.
The numbers leadership asks for, compiled automatically.
Revenue vs target94.2%
New pipeline added₹3.4 Cr
Collected this week₹62 L
Renewals due (30 days)11
SLA breaches2
Charts show sample data for illustration.
Revenue analytics
Target vs achievement
Department-wise performance
Customer performance
Sales forecasting
Receivables ageing
Operational bottlenecks
Management reporting
Industries we serve
Built for every industry. Designed for every team.
Arthavane is industry-agnostic. Wherever a business sells, delivers, serves customers and collects payment, it connects the picture.
SaaS & Software
Track ARR, pipeline, renewals and churn alongside collections.
IT Services & Consulting
Connect deals, project delivery, utilisation and billing.
FinTech & Financial Services
Monitor partner pipelines, onboarding and revenue by product.
EdTech & Education
Follow enrolments, counsellor performance and fee collections.
HRTech & Recruitment
See open mandates, placements, recruiter output and invoicing.
Marketing & Advertising
Track retainers, campaign delivery and client receivables.
Professional Services
Link engagements, billable work and outstanding fees.
AI, Data & Analytics
Follow proof-of-concept pipelines, delivery and contract value.
Cybersecurity
Track renewals, managed-service SLAs and account health.
Healthcare Technology
Monitor institutional deals, implementations and collections.
Logistics & Supply Chain
Connect bookings, on-time delivery and freight receivables.
Manufacturing & Industrial
See orders, dispatch, dealer performance and payments.
Construction & Infrastructure
Track project milestones, running bills and retention money.
Wholesale & Distribution
Follow distributor sales, stock movement and credit exposure.
Telecom & Technology
Monitor enterprise accounts, service levels and billing.
Energy & Renewables
Track project pipelines, commissioning and milestone payments.
Automotive & Mobility
See fleet and dealer sales, service operations and dues.
Real Estate & Property Services
Follow leads, bookings, handovers and instalment collections.
Solutions by role
Designed for every role.
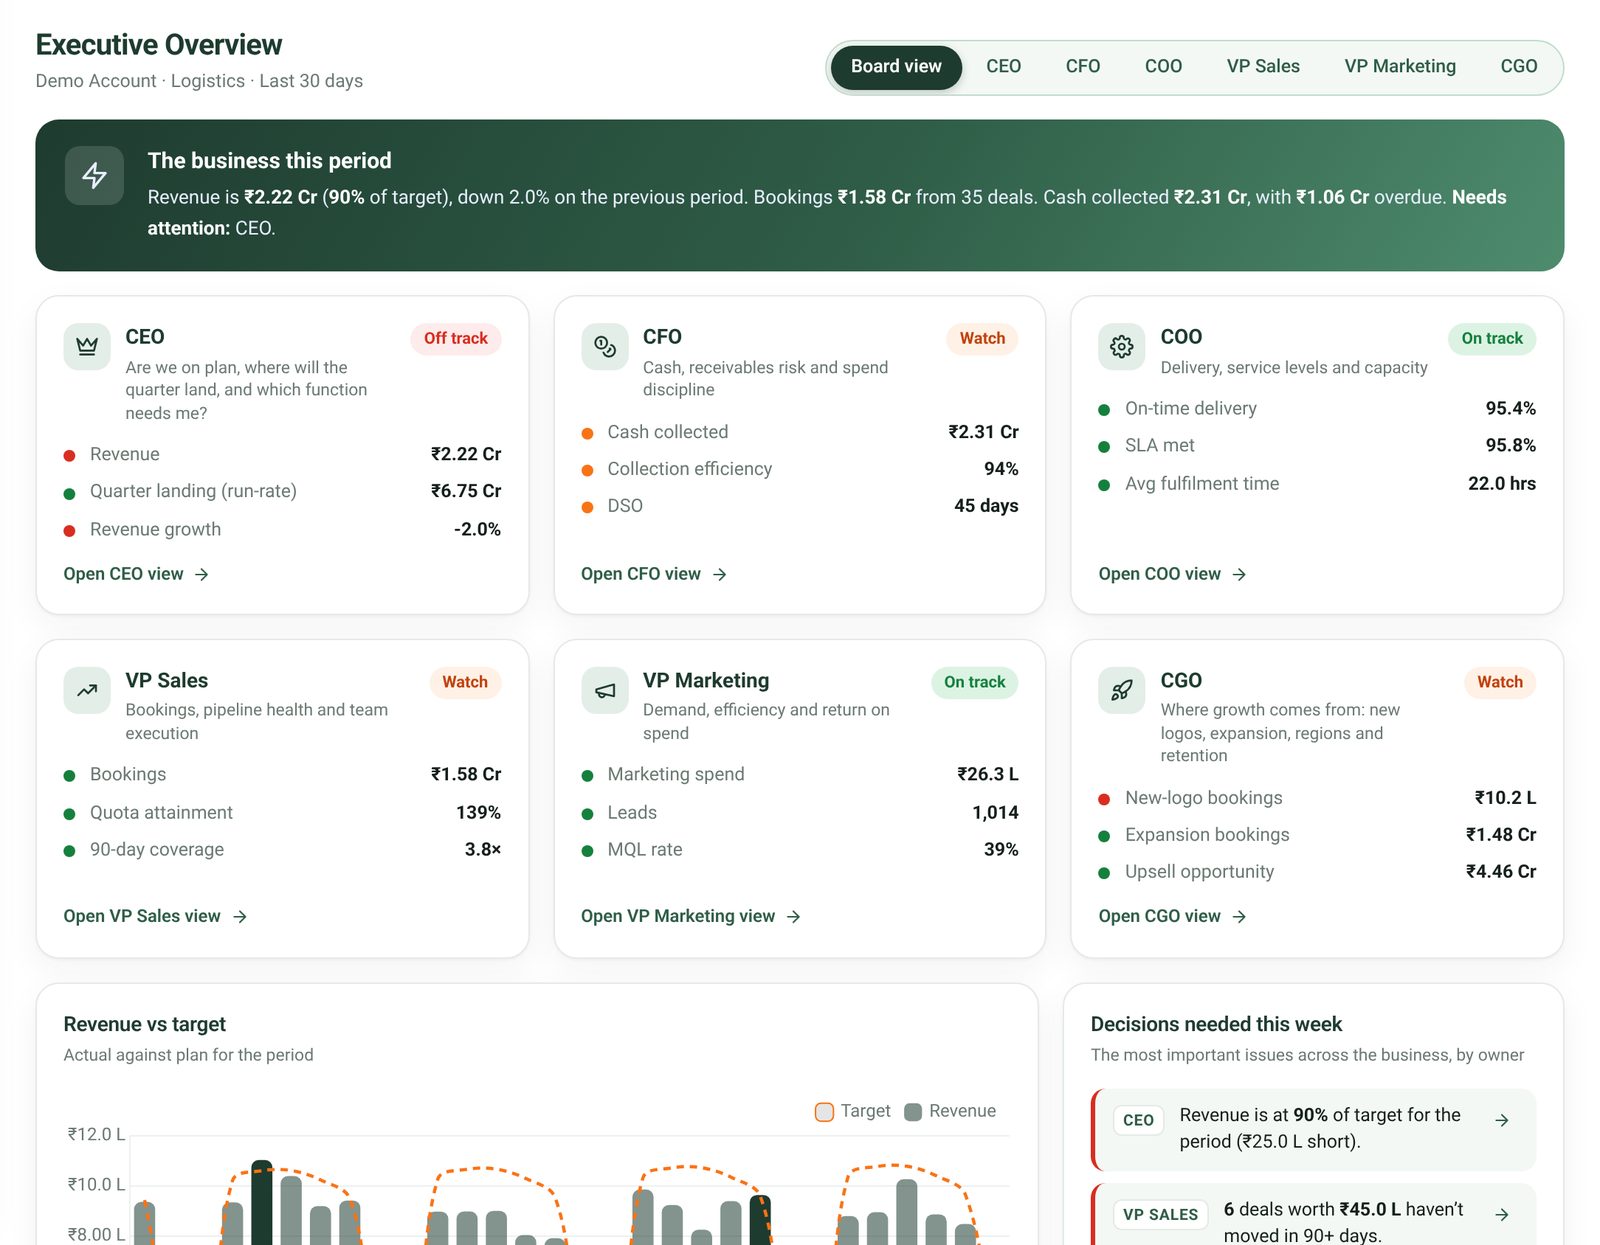
The Executive Overview opens on a board view of the whole business, then gives each leader their own view: six numbers, two charts and a short list of what to act on. Every view is built on the same shared numbers.
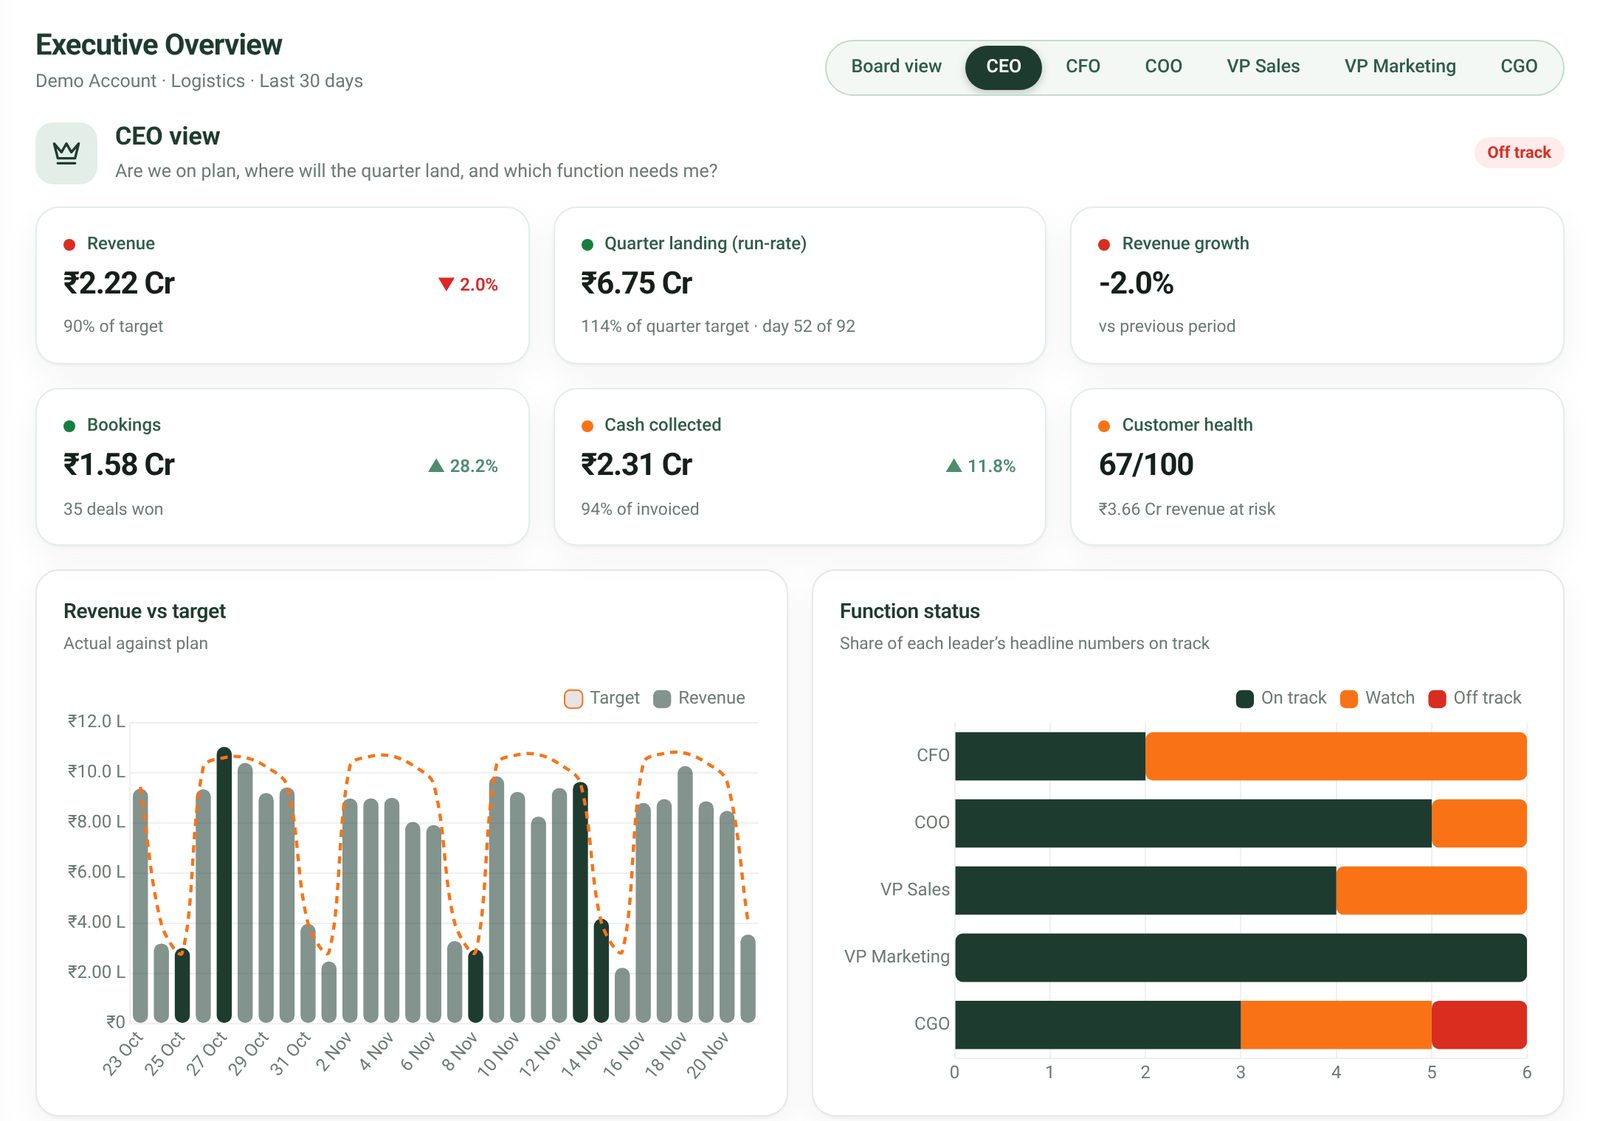
CEO view
Are we on plan, where will the quarter land, and which function needs me?
What you see
Revenue against target
Where the quarter lands at today's run-rate
Revenue growth and bookings
Cash collected
Customer health and revenue at risk
Status of every function in one chart
What it helps you act on
Which function needs leadership time this week
Whether the quarter plan is still realistic
Where to pull forward late-stage deals
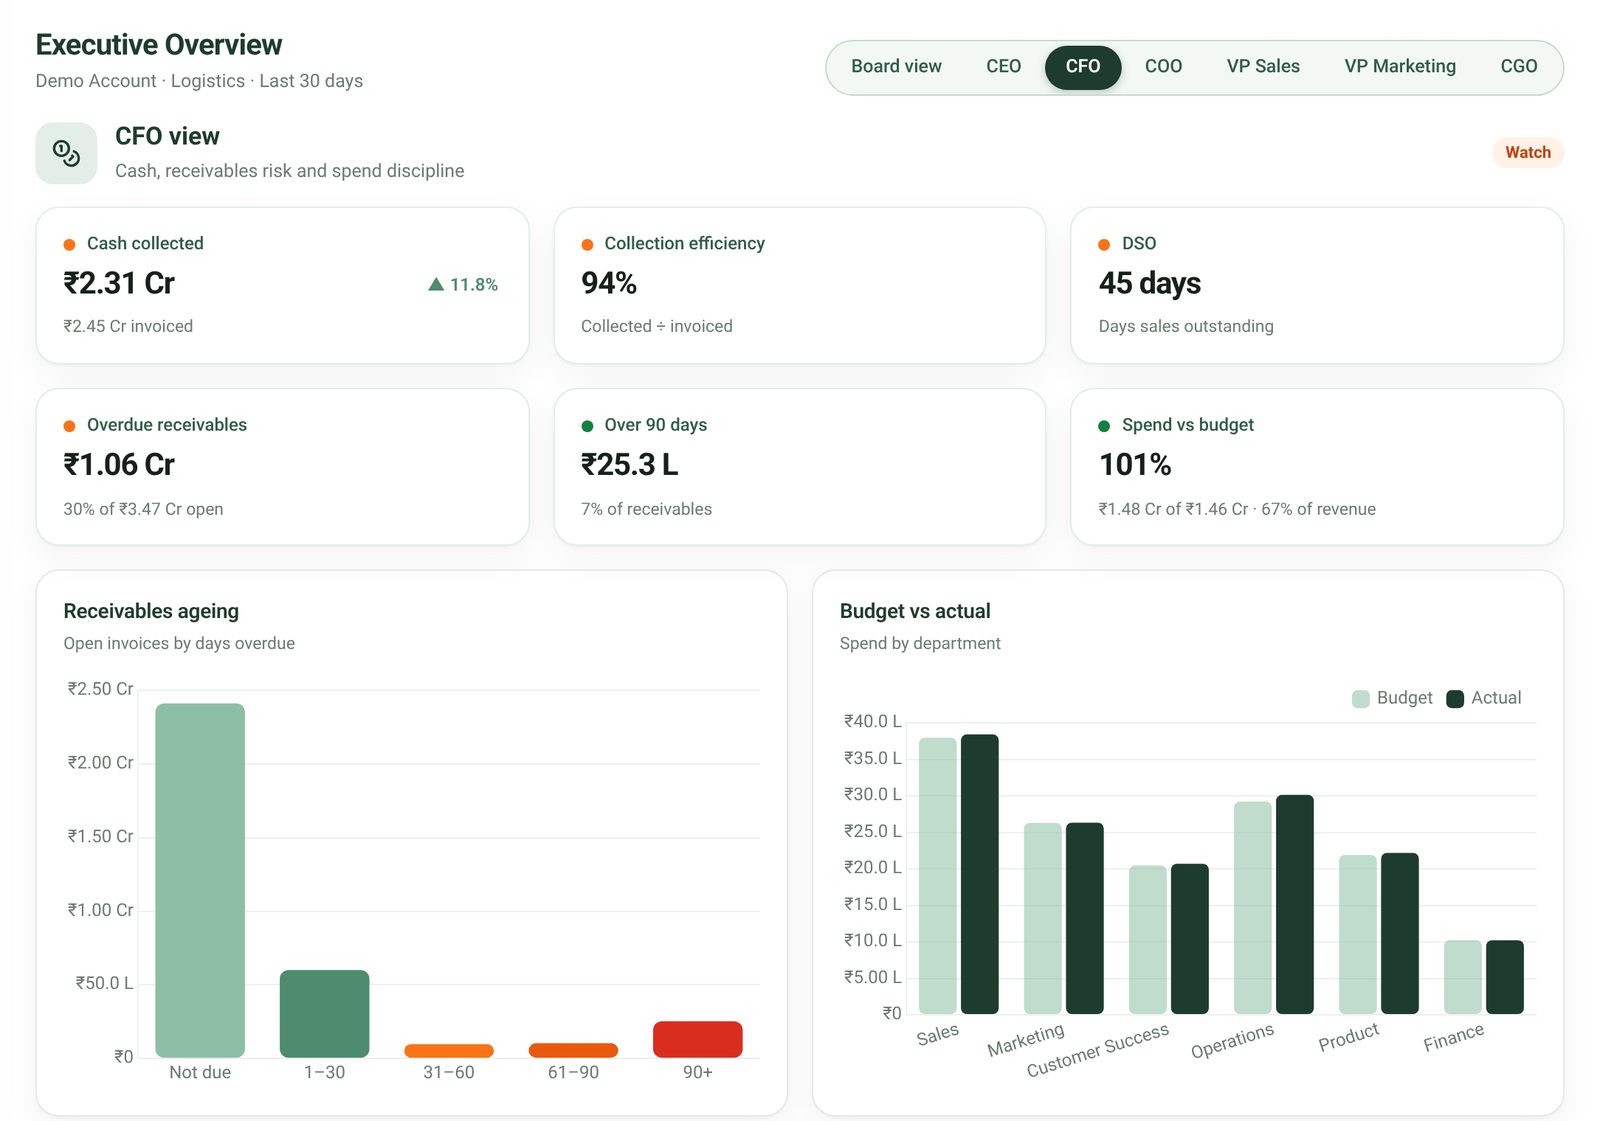
CFO view
Cash, receivables risk and spend discipline.
What you see
Cash collected and collection efficiency
DSO (days sales outstanding)
Overdue and 90+ day receivables
Receivables ageing
Spend against budget by department
Spend as a share of revenue
What it helps you act on
Which overdue accounts to escalate first
Which department is over budget
Where credit terms need tightening
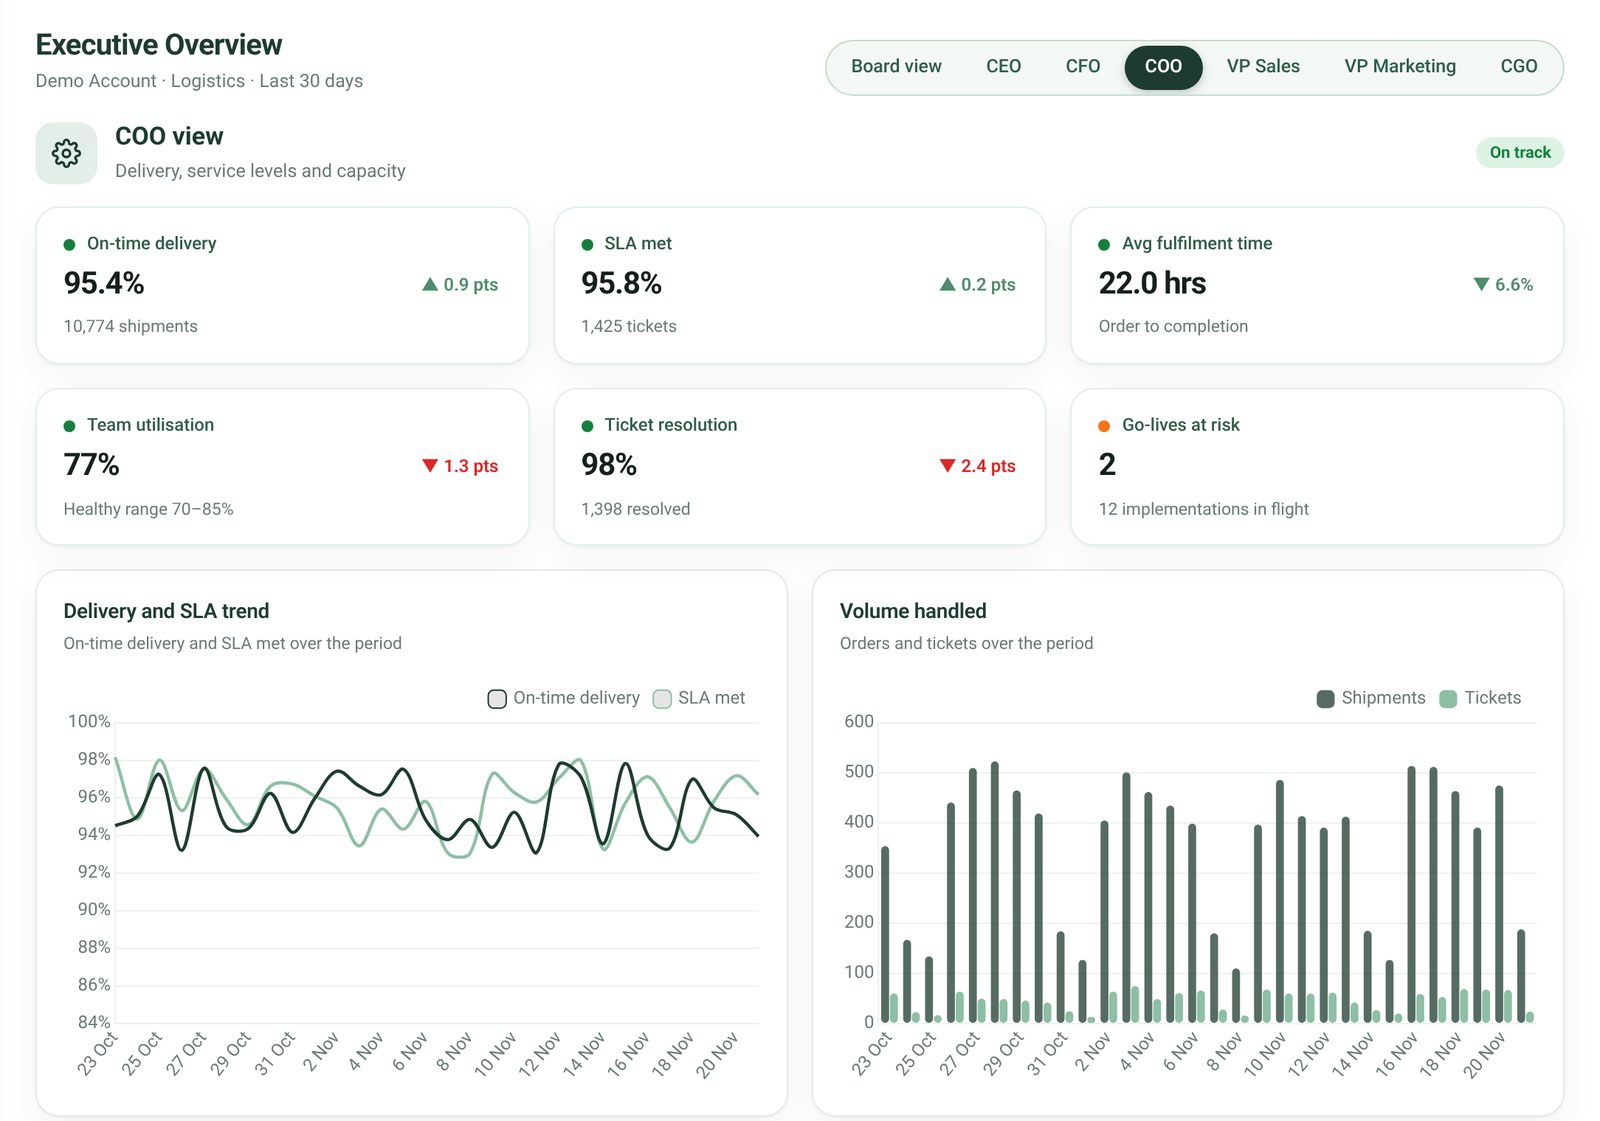
COO view
Delivery, service levels and capacity.
What you see
On-time delivery and SLA met
Average fulfilment time
Team utilisation
Ticket resolution
Customer go-lives at risk
Delivery and volume trends
What it helps you act on
Where service is slipping below standard
Whether the team is over or under capacity
Which implementations need attention
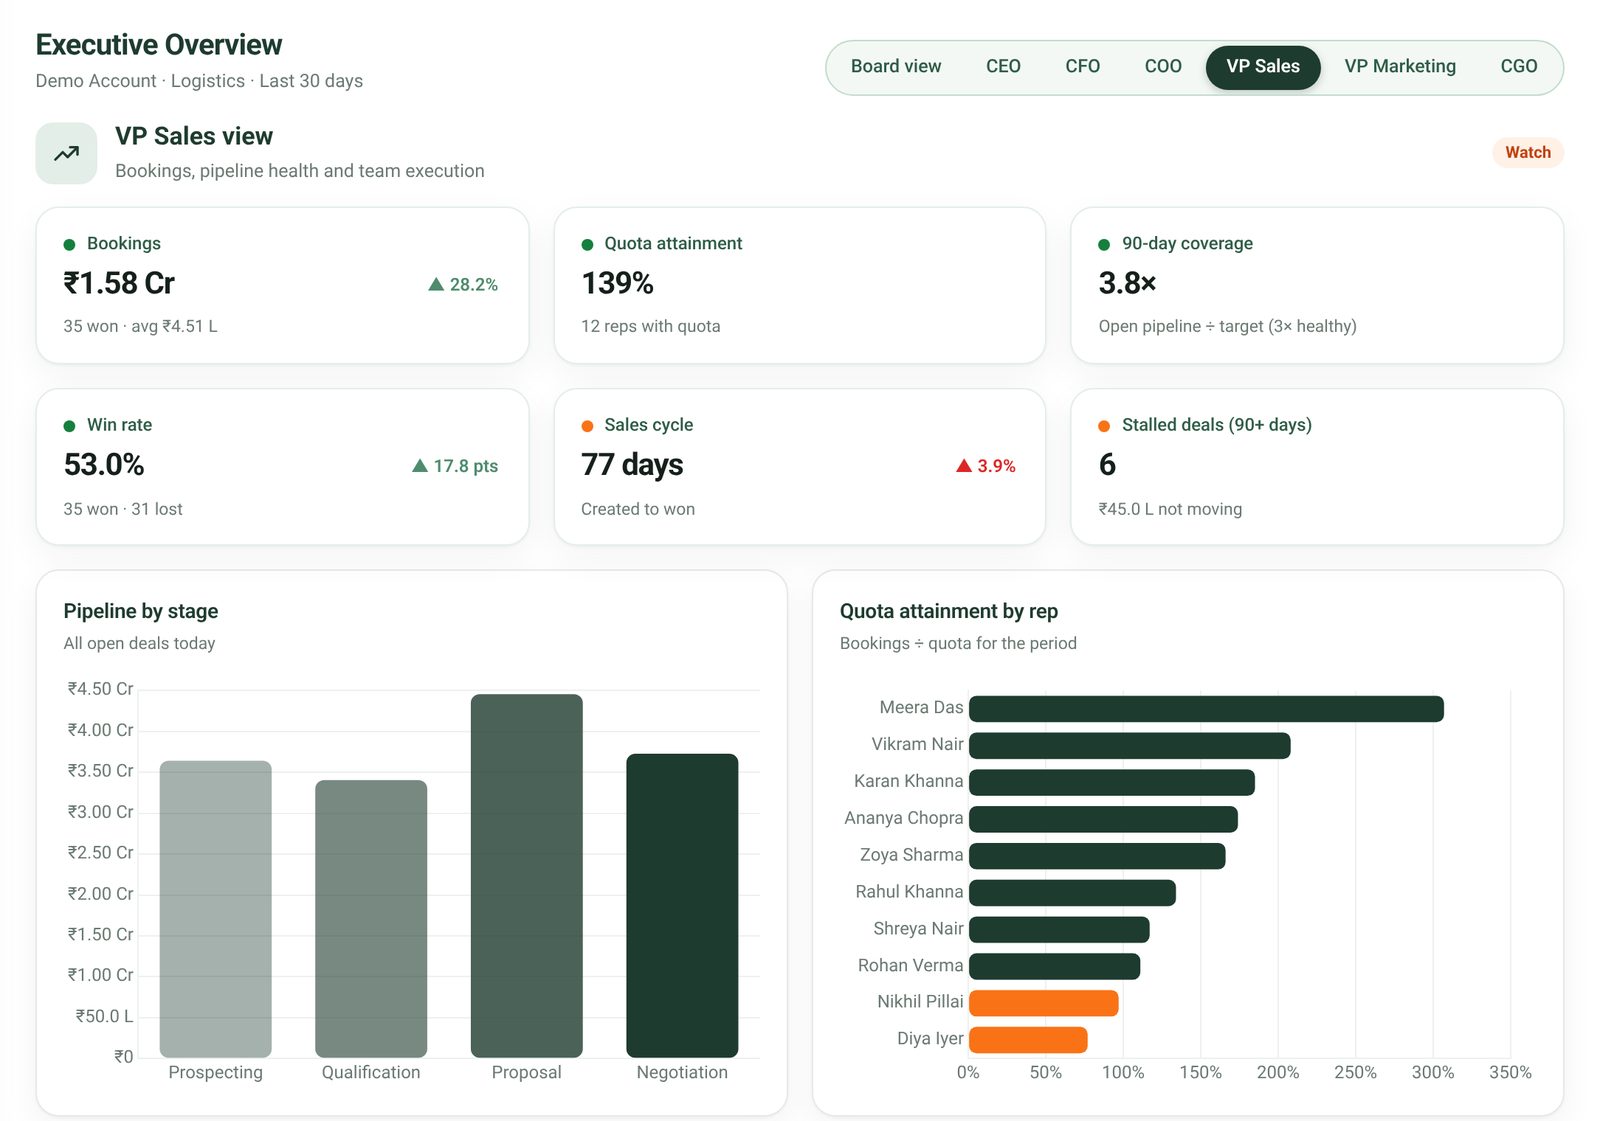
VP Sales view
Bookings, pipeline health and team execution.
What you see
Bookings and average deal size
Quota attainment, rep by rep
90-day pipeline coverage
Win rate and sales cycle
Pipeline by stage
Deals stalled for 90+ days
What it helps you act on
Which stalled deals to revive, and with whom
Whether there is enough pipeline for next quarter
Which reps need coaching
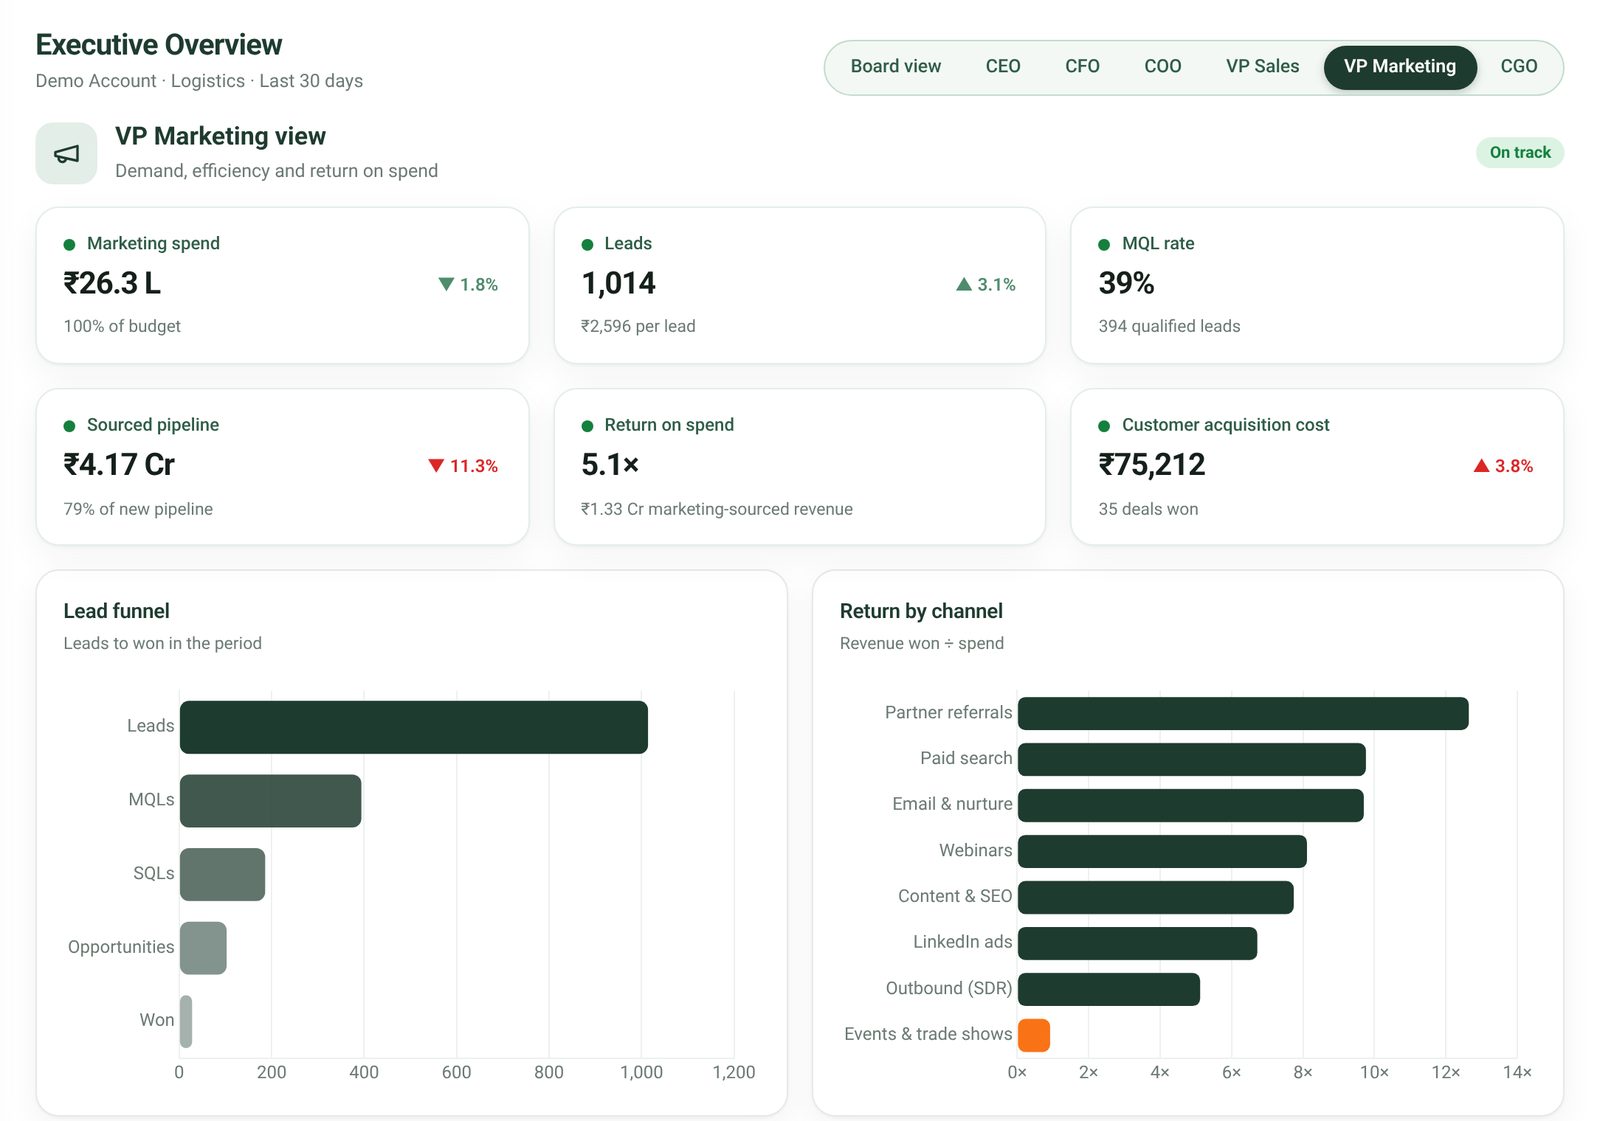
VP Marketing view
Demand, efficiency and return on spend.
What you see
Marketing spend against budget
Leads and cost per lead
MQL rate
Marketing-sourced pipeline
Return on spend by channel
Customer acquisition cost
What it helps you act on
Which channels to grow or cut
Whether spend is turning into pipeline
Where lead quality is slipping
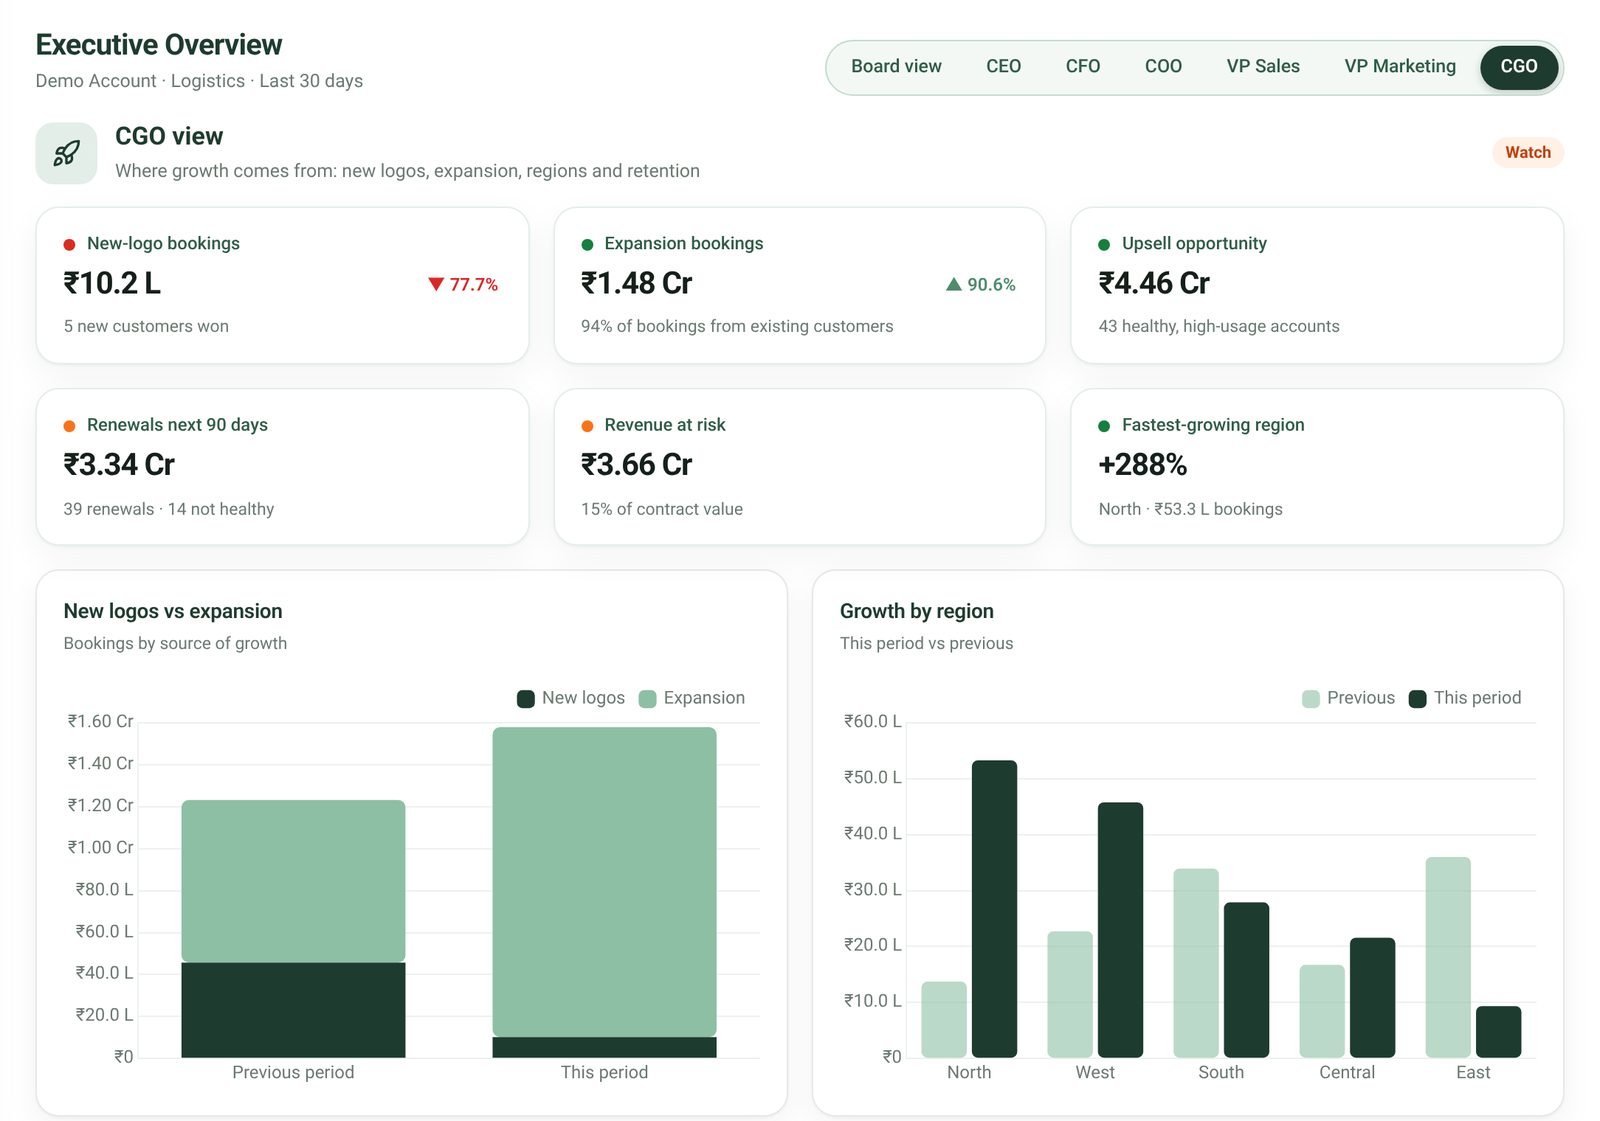
CGO view
Where growth comes from: new logos, expansion, regions and retention.
What you see
New-logo and expansion bookings
Upsell opportunity in healthy accounts
Renewals in the next 90 days
Revenue at risk
Fastest-growing region
Growth by region against the previous period
What it helps you act on
Which accounts are ready for an upsell conversation
Which renewals to protect now
Which region to invest in next
Why Arthavane
Everything your business needs to stay connected.
Unified business visibility
Sales, operations, customer success and finance in one connected view.
Centralised reporting
One set of numbers that every team and every review works from.
Department accountability
Clear targets and owners for every function, visible to all.
Better decision-making
Decide on current facts, not last month's reports.
Performance monitoring
Track progress against plan continuously, not just at month-end.
Less spreadsheet dependency
Bring in the spreadsheets you have once, then stop rebuilding them.
Improved operational efficiency
Spot bottlenecks and delays while there is still time to act.
Revenue and cash-flow visibility
See what has been earned, billed, collected and is still owed.
About us
Built for leaders who want one version of the truth.
Arthavane is led by Founder & CEO Cinthya Rao from Bengaluru, and backed by advisors with about 20 years in B2B sales, revenue and operations across SaaS, logistics, supply chain and financial services. The name joins artha, Sanskrit for wealth and purpose, with a vane that shows which way the wind is blowing.
Your data stays yours
Each company's data is kept separate, and we never sell it or use it to train AI models.
Start with what you have
Bring in your existing Excel and CSV exports. No rip-and-replace.
Plain answers
Clear numbers and plain language for every leader, not just analysts.
Cinthya RaoFounder & CEO, Arthavane · Bengaluru
Cinthya leads Arthavane day to day: working with customers, shaping the product around how their teams actually run, and making sure every leader gets a clear answer from their numbers.
Backed by advisors with ~20 years in B2B sales and revenue leadership.